In the post Startup reporting template for insights, an important part was how to focus on a key metric (e.g. MRR for SaaS startups) and break it into subparts in order to get more insight. All this is easy to get it you structure your data well. Let’s start with a simple version!

Structure, structure, structure
The basics to get analytics right is to simplify the existing data first. A good place is usually to start with billing information. For a start, it’s directly linked to cash, therefore highly relevant. Secondly, it’s usually quite structured in a database, therefore easy to exploit.
The second step is to define a temporal granularity. You can use weekly or monthly aggregate depending on your business model and your preferences. While each month have a different number of days (making it difficult to compare January to February), weeks are more difficult to compare year over year and there is some leap weeks (I recommend to use ISO 8601). You can obviously use both, but it would add too much complexity at this point. We will use a monthly granularity from here.
The only metric we will use is MRR (Monthly Recurring Revenues). To be meaningful, it doesn’t equal your monthly revenues. If your customer pays $120 for a year on January 14, 2018, you take a MRR of $10 from January 2018 until December 2018. There is no MRR in January 2019 because it wouldn’t be recurring at this point (the customer will have to renew on January 15, 2019).
If your billing is time dependent (like AWS which bill by the second), you might want to normalize to 30 days. For instance, if a customer consumes $10 of credit from January 25 (account creation) until January 31 (7 days of use), the MRR would be ($10/7*30) = $42,86.
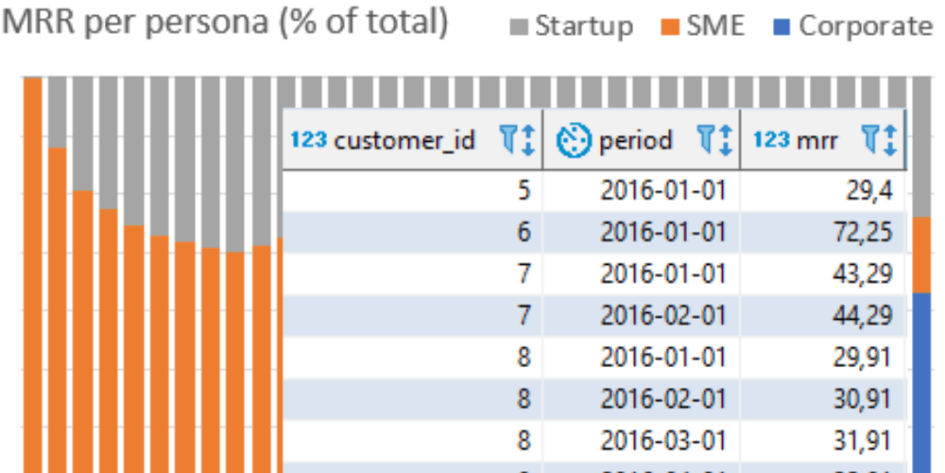
From here, you can construct the lifetime table which simply contain a customer identifier, each period with a MRR for this customer and the corresponding MRR.

While there is already a lot to learn, it would be useful if you can add some details on your customers. I can think of the acquisition channel (where the client is coming from) and the persona. While the acquisition channel can come from UTM tags or the CRM tool, the persona can come from a specific billing plan or by manual labeling.

Those two tables can be views over your database or stored in what would be the beginning of a data warehouse.
Exploit with ease
While there are many tools at your disposal (Tableau, Looker, …) Excel should be more than enough for a pre-serie A startup (and way after that). You can use Power Query / ODBC to create a bride to your database and Power Pivot. Those two tools (included in all version of Excel Office 365) allows you to manage datasets with more than 1 million rows and to exploit them effectively. It’s the same backend than PowerBI (which works on the cloud or on premise). For those who prefer Google to Microsoft, Google Data Studio is fine as well.
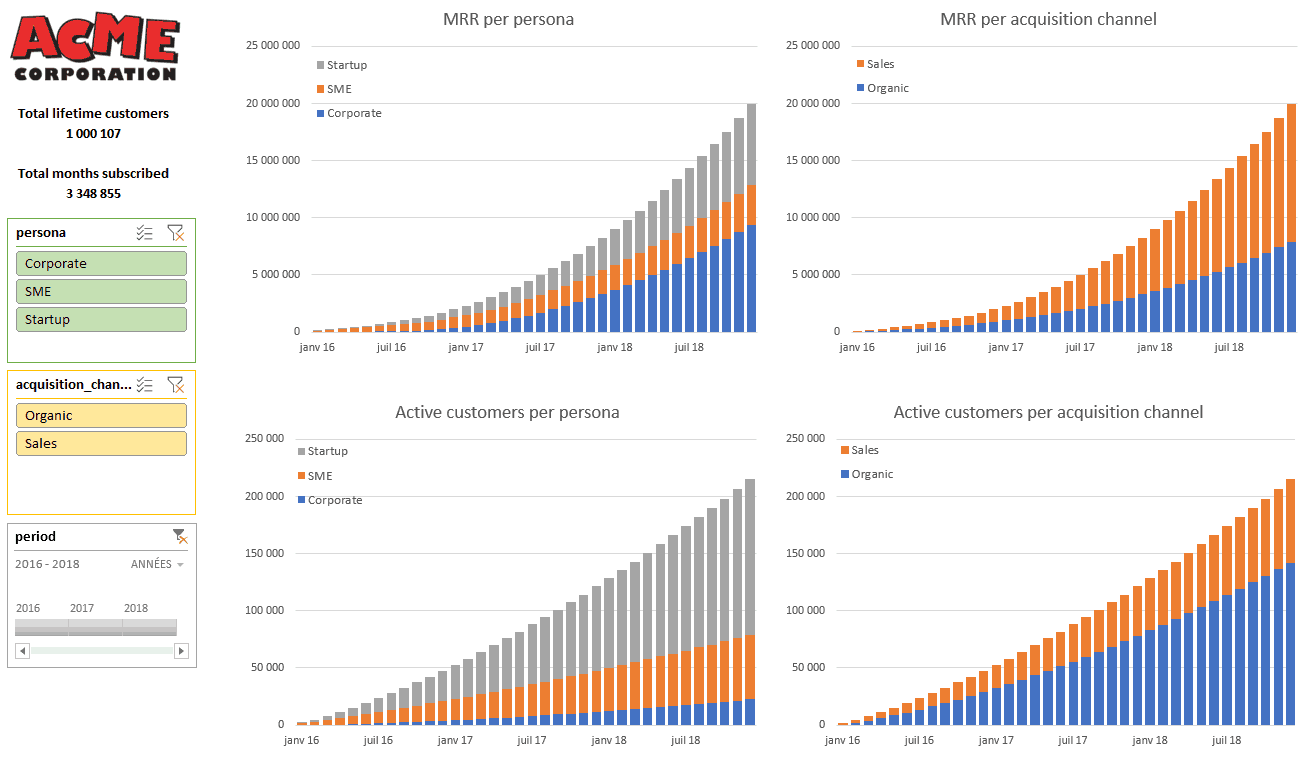
You can now easily analyze your subscription data which a dashboard like the one below. The slicers (selectors) on the left allows to quickly zoom in or out to analyze specific parts.

All this should be refreshed easily refreshed automatically or with just a refresh button.
Drill, drill, drill
As you might guess from the global dashboard, for the ACME Corporation sample, while SME (small and medium-sized enterprise) where leading the MRR, the business is now shifting toward bigger corporate clients even if they represent less than 20% of their clients.

If we compute the average MRR per customer, we can see that Corporate clients are increasing their usage with time making them super valuable.

All those manipulation are super fast to compute (no more than a few seconds) and easy to change allowing you to concentrate on analysis. That’s because the data is well structured.
But there is more information to extract from this dataset. It will need a little bit of SQL wizardry so subscribe to the newsletter below to stay tuned.
Let's stay in touch with the newsletter


