I love weekly and monthly reports. Every time you build (or read) one you never know where it will bring you. For most people, it’s just a way to communicate information (to your investors for instance). In that case, it’s most likely that the dashboard isn’t good and it’s a waste of time. A good report is a tool to reflect on the business, generate insights and find new questions that you need to answer (which need more detailed analysis) to achieve growth.
Let’s dig a bit on how to make an insightful one-page report (one page is the best size so you can contemplate every bit of information).
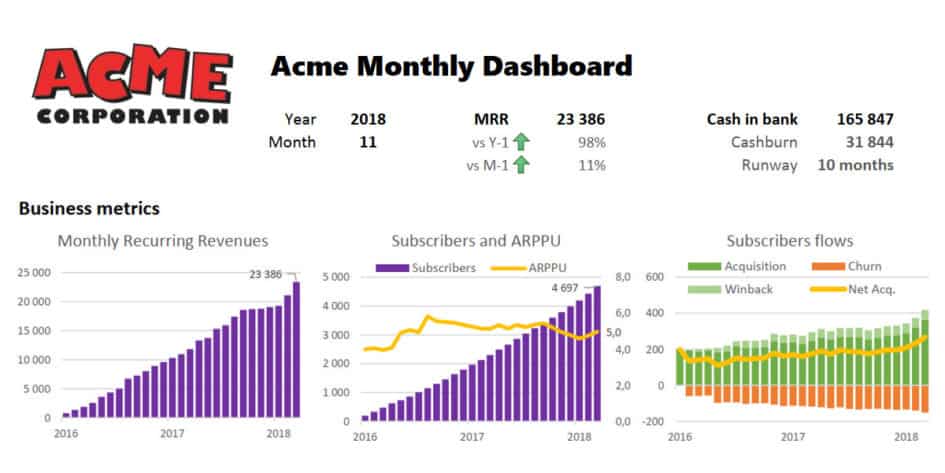
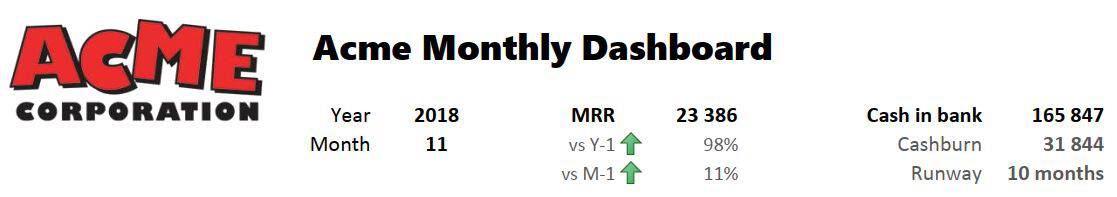
First, you need to identify 2-3 metrics that describe best your business situation. For a SaaS startup, it can be MRR (growth) and cash available (survival). Every stakeholder should understand them very well. It will set the mood for the rest of the report. It should be fairly stable (you don’t change your Key Performance Indicators every quarters).
For instance, if your business has seasonality (demand is not uniform over the year), it makes no sense to give the MRR evolution over the previous month.
I got one startup that reported a +80% sales month over month attributed to a good marketing operation. Guess what? That kind of increase happened every year in September because students start their new year. Bad use of data led to a wrong insight.
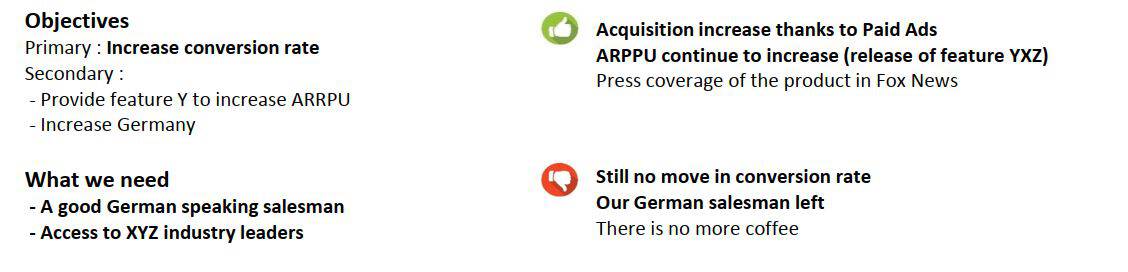
The next part is devoted to send text message to the audience (as well as reflecting on them for the report builder). The first part state the current objectives. They need to be specific and actionable (increasing growth isn’t very specific). Then, a “What we need” section allows you to engage the reader (investors). If the report is just for you, frame your next month tasks. Therefore, you will feel more committed. Finally, a “what went right and what went wrong” section so the reader get a bit of context
and extra-metrics information before reading the business metrics.
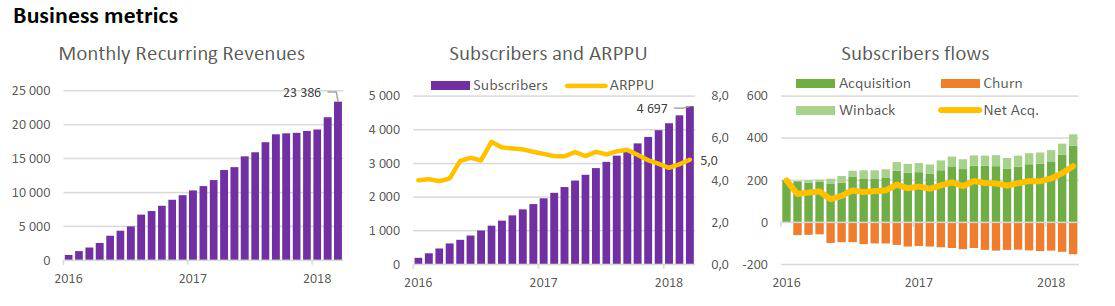
The business metrics part should be structured in order to give a good feeling on where the growth comes from. You start with the main KPI (here MRR) then you break it in its sub-part (here MRR = Subscribers * ARPPU, Average Revenues Per Paying Users). Then you break those sub parts when appropriate (here the subscriber count is explained by the variation due to acquisition, churn and winback). This part answer the “What happened?” question. It should be stable but can evolve according to your primary objective. As we stated that the primary objective was to increase conversion rate, maybe we need to break acquisition in smaller part (volume and conversion rate by acquisition channel).
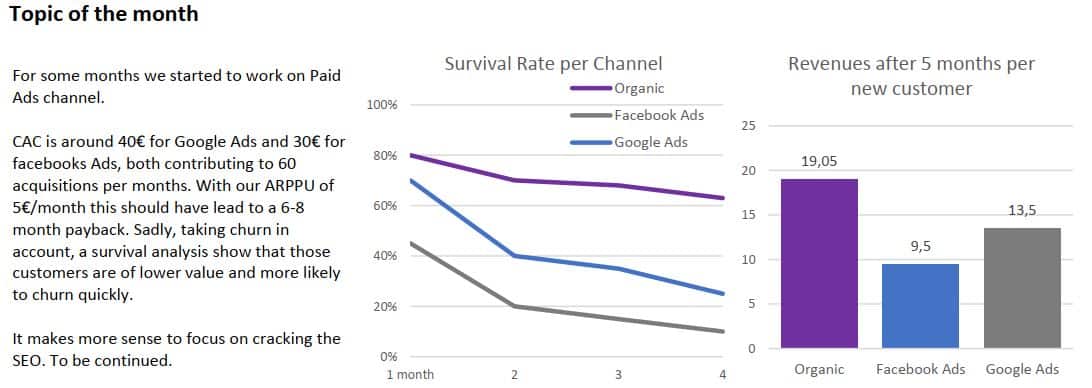
Startup growth is all about learning. The faster you learn, the more growth you get. The Topic of the month section is the opportunity to convey one learning. It also forces you to learn one thing every month just to fill the space.
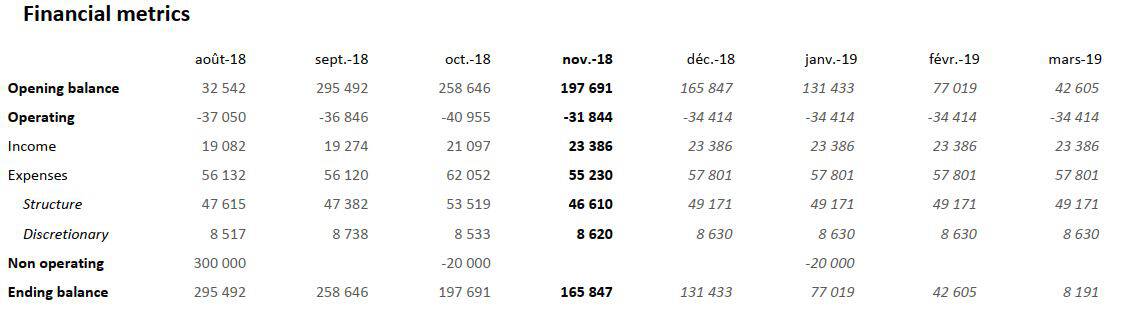
Finally, it is important to have a quick read on financials metrics. It shouldn’t be a detailed P&L. The best tool is a monthly cashflows statement because it’s easy to build and easy to understand.
It is easy to build as you start from the bank report (hopefully in CSV or something that can be used). You sort it by amount, label the most significant rows, and assign the rest to a default section.
And that’s it! The report here is made with Excel and it shouldn’t take you more than 30 minutes to update it (excluding the topic of the month section). Data need to be fetched directly from the database.
If you need helps setting up this kind of report, contact me or take a look at Data Brewery.
Let's stay in touch with the newsletter