
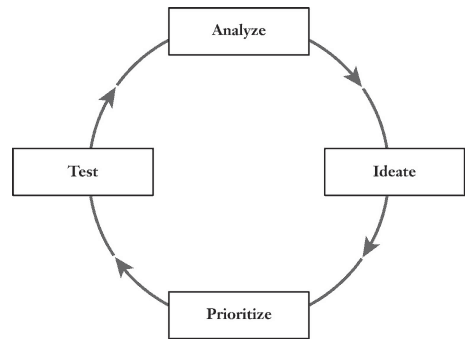
Growth Hacking is quite similar to Data Science (or lean startup) in regard to the iterative process. It’s also a big customer of data science because of the analyze part. Therefore keys points in Hacking Growth : How Today’s Fastest-Growing Companies Drive Breakout Success from Sean Ellis and Morgan Brown relate to data. Let’s explore them.
The need of a data warehouse
As soon as the Chapter 2, the authors emphase that building a data warehouse is key to success. Indeed, it is hard to iterate on growth hacking loops without have a sense on the effect of each hack.
What that means is that it’s not about simply reviewing data provided by the various tools and dashboards out there; to uncover what makes (or will make) your product a must-have, you need to collect the right data for your business, and build the connective tissue between various sources,
Granted, it is easy these days to have a lot of analytics (Google Analytics, Apple Store, Firebase, Facebook, Mailchimp, …) but the key is to blend them and focus on what is important instead of what is available. While it is easy to test a Facebook Ad message and find which one is more likely to be clicked on, it is more valuable to follow the customer journey until the churn. Maybe a less effective ad (in term on click rate) is better to convert a specific valuable subpopulation (more likely to be premium).
combining all of your data so that you can do detailed tracking of customers throughout the experience funnel is essential to learning how to make your product must-have. If you haven’t pooled all your data at that stage, then it’s imperative to take the time to do it now
Metrics that matters
In the chapter “Identifying your growth levers”, the authors emphase to put the business model into a simple equation. This way, you can see how each component impact your growth and perform a marginal analysis (e.g. what is the real impact of an improvement on each component).
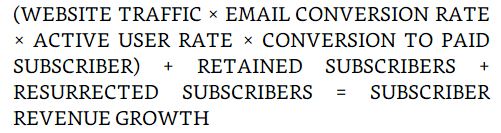
As a first benefit, having this equation avoid missing an important part. For instance, in the equation above, you might figure out that resurrecting previous subscribers is more effective than increasing website traffic. Nevertheless, it is easy to forget about them.
The second benefit is that, from here, you can industrialize growth. From the equation, you can generate growth ideas for each part, then prioritize them. On this topic, the book offers the ICE score system (ICE for Impact, Confidence and Ease). Then, after testing, you can see how you improved the equation and make the loop again and again.
Design accessible reporting
Good dashboards are key to data exploitation. We already covered it in the previous post : Startup reporting template for insights and the authors emphase the importance of good dashboards.
We are huge fans of dashboards because (a) they help focus team members’ attention on key trends or metrics; and (b) they allow you to share findings with the whole company, which encourages more participation in the growth effort.
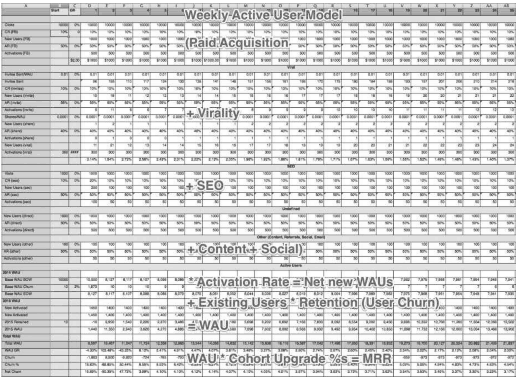
Indeed, most of startup reporting is somewhat like the table below, a big set of numbers that is difficult to relate and prioritize (which one is important, which one is secondary). For instance, the MRR, which is likely to be the utmost important metric is at the bottom on the report.
The value of data analysis
Having a strong data warehouse, good metrics and a beautiful dashboard is great, but the best insights need a proper data analysis to uncover them and the book give many examples of such insights that helped well know companies.
For instance, you can see below the retention rate of Twitter users per visits per month. As soon as people were checking Twitter eight days per month, the retention rate was insane.
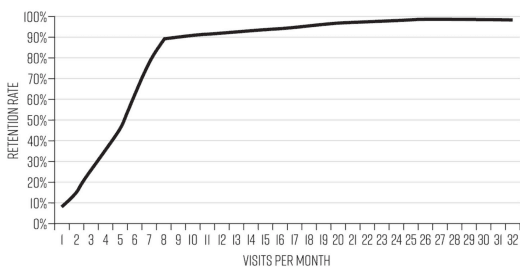
From this first insight, the data team make a correlation analysis using three cohorts : those with more than eight visits per month, those between two and seven, and a last cohort with people coming only once. They find that the big divide was the number of followed account (with a tipping point at 30). Therefore the growth team design ways to suggest accounts to follow when you are connected with less than 30 accounts.
Obviously, there is way more in the book : how to compose a growth team, how to manage it and a zillion tips or real life case that you can learn from.
Definitively a book you need.
Let's stay in touch with the newsletter